Millions of dollars are being invested in efforts to reduce the contribution of tropical deforestation to climate change. To find out whether that money is being well-spent, decision-makers choose from a variety of ways to measure avoided deforestation. But which one can be trusted? New research has found that different methods are more accurate in different sites, depending on the local deforestation drivers and the circumstances of the country.
REDD+, the UN-backed scheme aiming to compensate developing countries for reducing deforestation and forest degradation – is now more than a decade old, and several tropical countries, including Indonesia and Brazil will receive payments for results achieved.
Since some of the early REDD+ action was at the local level – with over 300 projects still active – it is important to understand if these initiatives contributed to reducing deforestation, and by how much. But what is the best way to measure that?
A new study by researchers from Wageningen University and the Center for International Forestry Research (CIFOR) tested the accuracy of two approaches and found there’s no one-size-fits-all answer – it depends on the context.
Satellites can be used to map forests and the changes that occur there. In 2008, the U.S. Geological Survey (USGS) opened its complete archive of Landsat satellite imagery, so researchers now have access to an unprecedented array of information dating back to the 1970s and covering the whole world.
How satellites help to map deforestation
More than a thousand satellites orbit the earth, and some of them are used to monitor land cover change – whether forests become farms or grasslands, or vice versa.
The Landsat 7 satellite orbits the earth in sixteen days, meaning that – clear sky permitting – every spot on earth is captured once in that period. The satellite contains seven different spectral bands, including the three bands that we see with our eyes (red, green and blue). Those three can be combined to produce so-called ‘true-color’ images, which look similar to how we see the world.
The other four bands allow scientists to monitor other phenomena, such as water content or vegetation. After stacking all the available pictures of one particular area of interest, a computer can be trained to look for irregularities over time. In this way, deforestation can be detected and mapped on global maps.
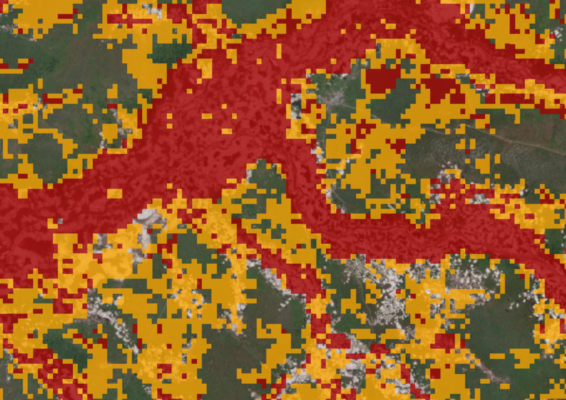
But different scientists train their computers in different ways. How sensitive should the computer be to changes in the vegetation? How should it distinguish between seasonality effects and “real” deforestation? Different decisions in the change detection process can therefore lead to different deforestation maps (see maps below), even when they originally came from the same pair of ‘eyes’ – the Landsat 7 satellite.
This has led to a huge increase in online tools that can be used to assess REDD+ performance.
Decision-makers can choose to use easily-accessible online map tools, which pinpoint deforestation across the entire globe, and more customised – but time-consuming – open-source deforestation-detection algorithms.
In practice, it is often difficult to judge which dataset best suits their purposes. The degree of expert knowledge needed to apply these tools and datasets differs greatly, too. People and organisations lacking expert remote-sensing skills could be expected to opt for the global dataset – the easiest, most accessible one. But is this the most accurate?
BETTER THAN THE SUM OF ITS PARTS
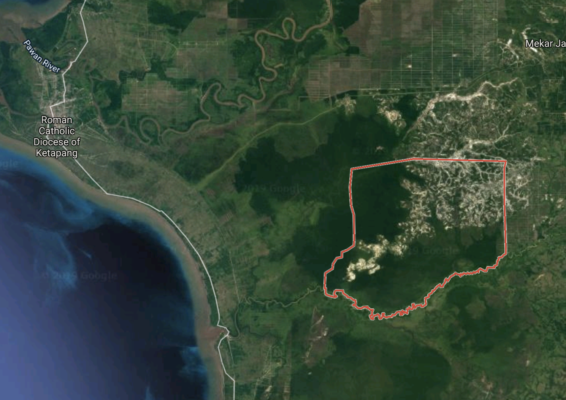
To find out, we gathered detailed local reference data on deforestation in five REDD+ project sites in Indonesia, Peru, Tanzania and Vietnam, and then compared that with the deforestation estimates for these sites from maps derived from two different tools – a global dataset and a locally-customisable algorithm.
When the results came in, there was no clear winner. We found that neither the global deforestation map nor the tailored algorithm performed better overall. Instead, each outperformed the other in different contexts.
The tailored algorithm was more accurate in Tanzania and Vietnam, but in the Indonesia sites, the global map performed better. In Peru, the difference in accuracy between the two maps was negligible.
It’s clear that each detection tool has its own strengths and weaknesses. While one might be better at detecting deforestation due to mining, the other could be more useful for spotting changes from the conversion of natural forests to oil palm plantations.
To address this, we tried to find out whether combining the information from the two different tools could produce a combined map that would be better than the sum of its parts.
We experimented with different combination strategies, and found that basing maps on the earliest detection of deforestation led to higher accuracies without considerably increasing the number of false-positives (areas marked as deforestation that were not actually deforested.)
However, this only held for the sites where both individual maps and tools were already reasonably good. One poor map can wreck the accuracy, even when combined with a good one.
MANAGING UNCERTAINTY
To assess REDD+ performance, one approach is to compare deforestation over a certain period after the interventions have started with deforestation in the years before then.
To assess the performance of the two datasets at our five sites, we used the average annual deforestation estimates for those two periods based on local high-resolution reference data – which were used to assess the accuracy of both tools and their combinations. Still, these deforestation estimates from reference data are subject to uncertainty, which is represented by the confidence intervals around them.
If deforestation is found to be trending downwards, that should mean REDD+ is having an effect. However, if the estimated trend in deforestation is slight, and there is high uncertainty, it’s possible that in reality, deforestation levels could be stable or even increasing – raising questions about whether compensation is justified.
In one site we found a distinct downwards trend in deforestation, regardless of uncertainty, while in the others – albeit to different degrees – uncertainty in the trend remained.
PUT YOUR MONEY WHERE YOUR DATA IS
In REDD+, unlike many other forest conservation strategies, those who help to keep forests standing should be rewarded with incentives. But such results-based payments rely on trustworthy data.
More than a decade ago, scholars pledged to be conservative in REDD+ accounting. The idea was that REDD+ performance measurements should be made as accurate as possible – but if uncertainty remains, calculations of avoided deforestation should be conservative.
But what does ‘conservative’ mean?
For one Indonesian site in our study, we applied different degrees of ‘conservativeness’ to the deforestation measurements – and this variable had a large influence on the final figure. For our case study, varying ‘conservativeness’ and ‘confidence’ resulted in estimates of reduced annual deforestation between 7 percent and 20 percent – a significant difference.
These factors, plus the uncertainties in the maps, can therefore greatly influence the deforestation measurements reported under REDD+, and thus whether or how much compensation should be awarded.
Being open and honest about the strengths and weaknesses of the maps and tools we create, and about the reporting standards we follow, should therefore become common practice.
We want you to share Forests News content, which is licensed under Creative Commons Attribution-NonCommercial-ShareAlike 4.0 International (CC BY-NC-SA 4.0). This means you are free to redistribute our material for non-commercial purposes. All we ask is that you give Forests News appropriate credit and link to the original Forests News content, indicate if changes were made, and distribute your contributions under the same Creative Commons license. You must notify Forests News if you repost, reprint or reuse our materials by contacting forestsnews@cifor-icraf.org.

