We are all encouraged by current political commitments that aim to “end deforestation” or “halt natural forest loss” in the next decade. These commitments have been made within the Sustainable Development Goals (Goal 15, target 2), the New York Declaration on Forests and decisions by the UN Framework Convention on Climate Change.
But, against what reference should we monitor progress towards targets expressed in these commitments? And do we have the processes in place to deliver accurate findings?
In an earlier article I compared attempts to assess changes in the global forest with the story about blind men and the elephant. Differences in methods, definitions, completeness and field verifications inevitably led to entirely incomparable results between Global Forest Watch and the FAO Global Forest Resources Assessment.
These results are widely communicated and used as a reference in many political and economic analyses. In fact, there are few alternative sources of information on global forest change.
However, given the conflicting information, the risks of misperception and erroneous conclusions are obvious. To determine how deep the confusion goes, we need to further scrutinize these publicly funded assessment reports.
Here, I examine country-level data produced by FRA 2015 and the GFW. For FRA 2015 I have used the average annual forest area change for 2010–2015, and for GFW the average “tree cover loss” for 2010–2014, as reported using an assigned 30% canopy cover threshold in the algorithm.
The global totals are -3.3 Mha/yr for FRA 2015 and -19.8 Mha/yr for GFW, noting that the five-year average for GFW is higher than the -18 Mha reported for 2014.
To make the data easier to digest, I’ve extracted the 29 countries that had more than 20 Mha forest in 2005, according to FRA 2005. Together, these countries represent about 85% of the world’s forests. Their total forest area change in the period according to FRA is -2.2 Mha/yr, and the “tree cover loss” in GFW 16.4 Mha/yr.
Going country by country, it is clear that the discrepancies are caused by quite different situations on the ground. I decided to subjectively divide the 29 countries into five categories in an attempt to highlight why these gaps are so significant.
Category 1. Complete contradiction – countries where FRA shows a stable or increasing forest area, whereas GFW reports major tree cover losses. Includes: Australia, Canada, China, Finland, Gabon, India, Malaysia, Russia, Sweden and the United States, representing about half of the world’s forests.
– FRA 2015: total gain of 2.4 Mha/yr
– GFW: total loss of 9.6 Mha/yr
Likely explanation: These countries show large tree cover losses, mainly from timber harvests. However, forest area is normally not affected by such harvests as the land use type remains “forest” and the stands are allowed to regenerate naturally or are actively replanted. In addition, some of these countries report an expected increase in forest area – something that GFW does not pick up. Most of these countries have sophisticated national forest inventory systems in place, and would have reported accurate numbers to FRA 2015.
Category 2. Reasonable correspondence – countries where there is negative forest area change and where the FRA and GFW area change figures are of the same magnitude. Includes: Angola, Argentina, Bolivia and Peru, representing 6% of the world’s forests.
– FRA 2015: total loss of 0.9 Mha/yr
– GFW: total loss of 1.0 Mha/yr
Likely explanation: In these countries, tree cover loss generally appears to be linked to deforestation events. None of the countries appear to have major expansions of forest lands, although forests that are established on non-government lands may be missed by FRA.
Category 3. Negative area changes (higher rate stated by GFW) – countries where the area trend is clearly negative, and where GFW tree over losses appear to exaggerate the changes. Includes: Brazil, Colombia, Democratic Republic of the Congo, Indonesia and Mexico, representing about 20% of the world’s forests.
– FRA 2015: total loss of 2.1 Mha/yr
– GFW: total loss of 5.0 Mha/yr
Possible explanation: Since several of these countries have advanced national forest monitoring systems, it is unlikely that their forest area changes are significantly off the mark. So, it appears that GFW reports considerable tree cover losses that are not related to deforestation events. Some of these are likely linked to forest management cycles (as for Category 1), and others may be due to changes outside the forest, e.g. oil palm plantations or other agriculture plantations.
Category 4. Negative area changes (higher rate stated by FAO) – countries where the area trend is clearly negative, and where FAO forest area change is larger than stated GFW tree losses. Includes: Cameroon, Myanmar, Sudan, Tanzania, Venezuela and Zambia, representing about 6% of the world’s forests.
– FRA 2015: total loss of 1.6 Mha/yr
– GFW: total loss of 0.6 Mha/yr
This category is interesting, as it is the only one where GFW’s losses are smaller than FAO’s. Since it is difficult to imagine deforestation events without tree cover loss (although it is theoretically possible), it appears likely that FAO’s losses are exaggerated. These countries generally have weak national monitoring systems, so the errors in reported data may be larger. The above African countries seem to have a history of exaggerating forest area changes for the region as a whole, as already seen in FRA 2000 (p. 316, fig 46–11).
Category 5. Relatively small changes reported by both FRA and GFW – countries where area changes appear to be relatively small. Includes: Central African Republic, Japan, Papua New Guinea and Republic of Congo, representing 3% of the world’s forests.
– FRA 2015: total loss of 0.04 Mha/yr
– GFW: total loss of 0.2 Mha/yr.
Conclusion
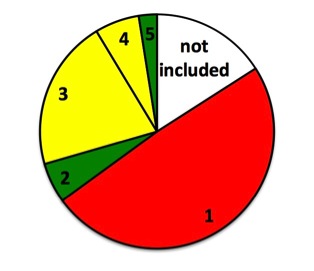
Correspondence between the two data sources is very low, illustrating that the numbers are registered using different methods and assumptions. Figure 1 shows correspondence relative to overall forest area.
For category 1 (red), there is clear contradiction; for categories 3 and 4 (yellow) the results show trends in the same direction, but differ by an order of magnitude; and for categories 2 and 5 (green) the correspondence is strong.

Figure 1. Forest area-weighted correspondence between FRA 2015 forest area change and GFW tree cover loss at country level for categories 1–5 above. Red=contradictory trends. Yellow=same direction of change but large differences in magnitude. Green=correspondence between data.
For categories 1, 2, 3 and 5, there is no reason to assume that FAO’s estimate of forest area change is far off the mark. For category 4, there is reason to believe that FAO has overestimated forest area reductions by about 1Mha/yr. If this is correct, it would mean that the global net forest area change is even lower than the -3.3 Mha/yr reported by FAO – possibly in the range of -2 to -2.5 Mha/yr. This figure could be even lower if the data take into account small-scale forests that are expanding onto previous farmlands. It appears as though neither FRA nor GFW are set up to detect such increases, despite their obvious significance.
Regardless of how accurate these assessments may or may not be, this omission means they aren’t directly suitable for monitoring progress towards recent political commitments to reduce or end deforestation
And finally, neither GFW, nor FRA provides data on deforestation, but on different, albeit related variables. Regardless of how accurate these assessments may or may not be, this omission means they aren’t directly suitable for monitoring progress towards recent political commitments to reduce or end deforestation.
Clearly, there is a case for improving and consolidating international statistics on forest changes, which may include:
- Institutions reporting on forests at the international level should be more open about discrepancies and uncertainties in their results.
- By combining in more collaborative ways the engagement of national institutions and experts, with internationally applied remote sensing technologies, uncertainties can be reduced and clarity improved.
- Commitments by States, the private sector and civil society, such as in the New York Declaration on Forests, should be accompanied by corresponding commitments to accurate monitoring of progress.
- Investment must increase to enable national institutions to implement forest and landscape monitoring over the long term. This should of course not be limited to forest area trends, but include all types of contributions from forests and landscapes to development.
We want you to share Forests News content, which is licensed under Creative Commons Attribution-NonCommercial-ShareAlike 4.0 International (CC BY-NC-SA 4.0). This means you are free to redistribute our material for non-commercial purposes. All we ask is that you give Forests News appropriate credit and link to the original Forests News content, indicate if changes were made, and distribute your contributions under the same Creative Commons license. You must notify Forests News if you repost, reprint or reuse our materials by contacting forestsnews@cifor-icraf.org.
